Iq imbalance fixer (iq_imbalance_fixer)
iq_imbalance_fixer is an asset in the ocpi.assets.dsp_comps component library. Implementations include iq_imbalance_fixer HDL Worker (iq_imbalance_fixer.hdl). Tested platforms include e310, xsim, zed.
Design
The IQ Imbalance Fixer compensates for amplitude and phase differences between quadrature I and Q input rails caused by differences in quadrature A/D devices. The goal is to drive the corrected output power difference between rails to zero and to also drive the corrected phase difference between rails to zero. This is accomplished via a feedback loop where the power and phase differences are measured and applied to the Q rail. In other words, the I output is a delayed version of the I input while the Q output has been corrected by removing amplitude and phase errors. This results in removal of the input spectral image.
The power difference is measured by \(I^2 - Q^2\), while the phase difference is measured by \(I*Q\). These loop errors are averaged over \(2^{+log2\_averaging\_length}-1\) input samples, which defines the update interval. The loop errors are filtered by single-pole IIR filters at the end of the update interval. The filters have a pole on the unit circle and have gain of \(2^{-neg\_log2\_loop\_gain}\). The filter outputs become the current c_corr and d_corr error correction values that are applied to the I and Q input streams, respectively. Input values are presented as corrected output values following four data valid cycles. This circuit operates at the full clock rate - that is, data valid may be held asserted every clock cycle.
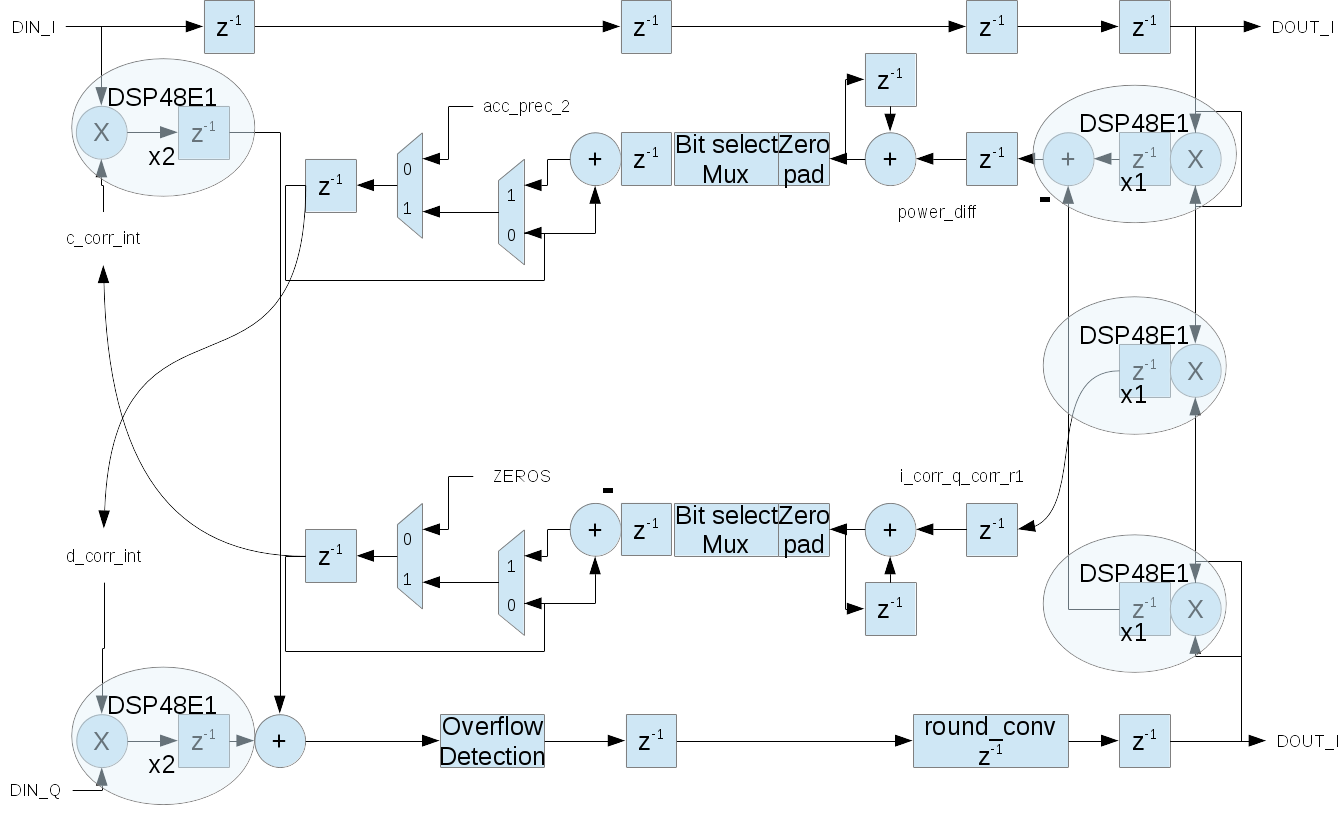
A block diagram representation of the implementation is given in Figure 142:
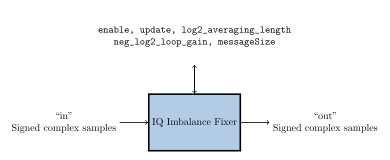
Figure 142: iq_imbalance_fixer block diagram.
Theory
A mathematical representation of a quadrature signal is given by the formula \(cos(2\pi t/T)+jsin(2\pi t/T)\). If we let \(\omega=2\pi t/T\), the equation of an imbalanced quadrature signal is \(cos(\omega)+j\alpha sin(\omega+\beta)\), where \(\alpha\) is the amplitude difference and \(\beta\) is the phase difference between I/Q rails. If we take the imbalanced signal and mix it with another frequency, such as upconverting or downconverting the signal, we essentially multiply the input signal by the tone \(cos(\omega0)+jsin(\omega0)\). The output signal then becomes a frequency-shifted version of the input signal given by \(cos(\omega-\omega0)+j\alpha sin(\omega-\omega0+\beta)\). The result is a spectral image of the original signal at \(-(\omega-\omega0)\). In the case of a non- zero linear combination of sine and cosine waves (which we have from a quadrature A/D, where the Q rail is simply a phase shift of \(\pi/2\) of the I rail), we may use the trigonometric identity \(\alpha sin(x+\beta) = Ccos(x) + Dsin(x)\), where C and D are constants and are the phase and amplitude errors applied to the I and Q input values, respectively. Thus the corrected output rails become I and \(CI+DQ\).
Interface
<!-- This is the spec file (OCS) for: iq_imbalance_fixer
     Add component spec attributes, like "protocol".
     Add property elements for spec properties.
     Add port elements for i/o ports -->
<ComponentSpec>

  <Property Name="enable" Type="bool" Writable="true" Default="true"
	    Description="Enable/bypass control"/>

  <Property Name="update" Type="bool" Writable="true" Default="true"
	    Description="Update the calculated amplitude and phase errors or hold previous"/>

  <Property Name="log2_averaging_length" Type="uchar" Writable="true" Default="11"
	    Description="Update interval control, where 2^(n+1) samples define the averaging length"/>

  <Property Name="neg_log2_loop_gain" Type="uchar" Writable="true" Default="5"
	    Description="Loop gain control, where the value is 2^(-n)"/>

  <Property Name="messageSize" Type="ushort" Writable="true" Default="8192"
	    Description="Unused property. Formerly used to set output message size"/>

  <Port Name="in"  Protocol="iqstream_protocol.xml"/>
  <Port Name="out" Protocol="iqstream_protocol.xml" Producer="true"/>

</ComponentSpec>
Properties
enable: Enable/bypass control.Type:
boolAccess:
Parameter:
FalseWritable:
TrueInitial:
FalseVolatile:
False
Default value:
true
update: Update the calculated amplitude and phase errors or hold previous.Type:
boolAccess:
Parameter:
FalseWritable:
TrueInitial:
FalseVolatile:
False
Default value:
true
log2_averaging_length: Update interval control, where 2^(n+1) samples define the averaging length.Type:
ucharAccess:
Parameter:
FalseWritable:
TrueInitial:
FalseVolatile:
False
Default value:
11
neg_log2_loop_gain: Loop gain control, where the value is 2^(-n).Type:
ucharAccess:
Parameter:
FalseWritable:
TrueInitial:
FalseVolatile:
False
Default value:
5
messageSize: Unused property. Formerly used to set output message size.Type:
ushortAccess:
Parameter:
FalseWritable:
TrueInitial:
FalseVolatile:
False
Default value:
8192
Ports
Inputs:
inProtocol:
iqstream_protocol.xmlOptional:
False
Outputs:
outProtocol:
iqstream_protocol.xmlOptional:
False
Implementations
iq_imbalance_fixer(HDL)
Dependencies
The dependencies to other elements in OpenCPI are:
projects/assets/components/dsp_comps/iq_imbalance_fixer/iq_imbalance_fixer.vhd
projects/assets/hdl/primitives/dsp_prims/dsp_prims_pkg.vhd projects/assets/hdl/primitives/dsp_prims/iq_imbalance/src/iq_imbalance_corrector.vhd
projects/assets/hdl/primitives/util_prims/util_prims_pkg.vhd projects/assets/hdl/primitives/util_prims/pd/src/peakDetect.vhd
Limitations
Limitations of iq_imbalance_fixer are:
None.
Testing
A single test case is implemented to validate the IQ Imbalance Fixer component. An input file is generated consisting of a waveform with tones at 5 Hz, 13 Hz, and 27 Hz, and creates a spectral image by both adding different gain to I and Q rails and also adding an additional 10 degrees of phase to the sine portion of the complex signal. The result is the addition of spectral image tones at -5 Hz, -13 Hz, and -27 Hz. The complex waveform is then scaled to fixed-point signed 16-bit integers, with a maximum amplitude of 31000 to avoid roll-over.
Time and frequency domain plots may be viewed in Figure 143: and Figure 144: below, respectively, where the time domain plot represents the first 128 complex samples in the file.
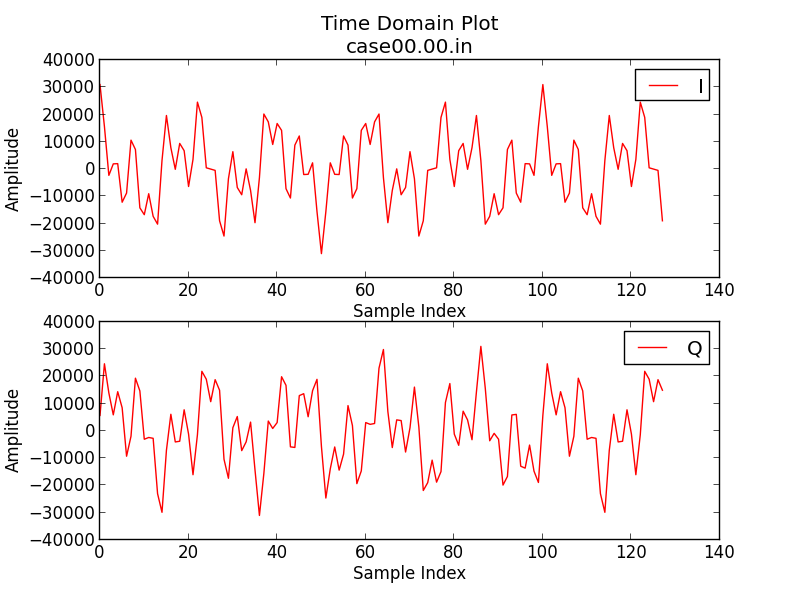
Figure 143: Time Domain Tones with Spectral Image
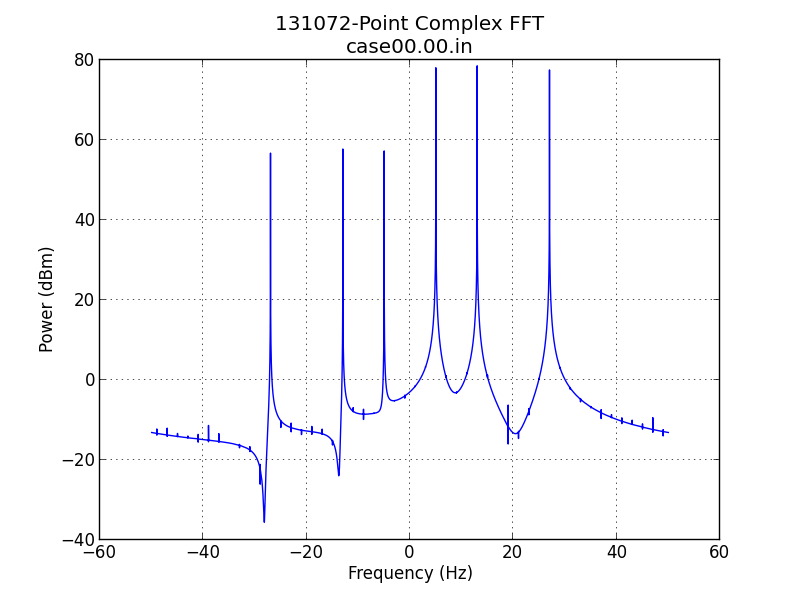
Figure 144: Frequency Domain Tones with Spectral Image
Verification of output data is performed only on the second half of the output, which represents the steady state of the component. The output is first checked that the data is not all zero, and is then checked for the expected length of 65,536 complex samples. Once these quick checks are made both the input and output data are translated to the frequency domain, where a FFT is performed, and then power measurements are taken at 5 Hz, 13 Hz, 27 Hz, -5 Hz, -13 Hz, and -27 Hz. The input and output power measurements are compared to validate that the IQ spectral image has been attenuated and that the other tones have not been attenuated. In addition, the FFT bin with the maximum power in the range of DC to +Fs/2 is compared to the maximum power bin in the range of -Fs/2 to DC to verify at least 65 dB of suppression has taken place with respect to the spectral image. Figure 145: and Figure 146: depict the filtered results of the three tone input, where the time domain plot represents the first 128 complex samples in the file.
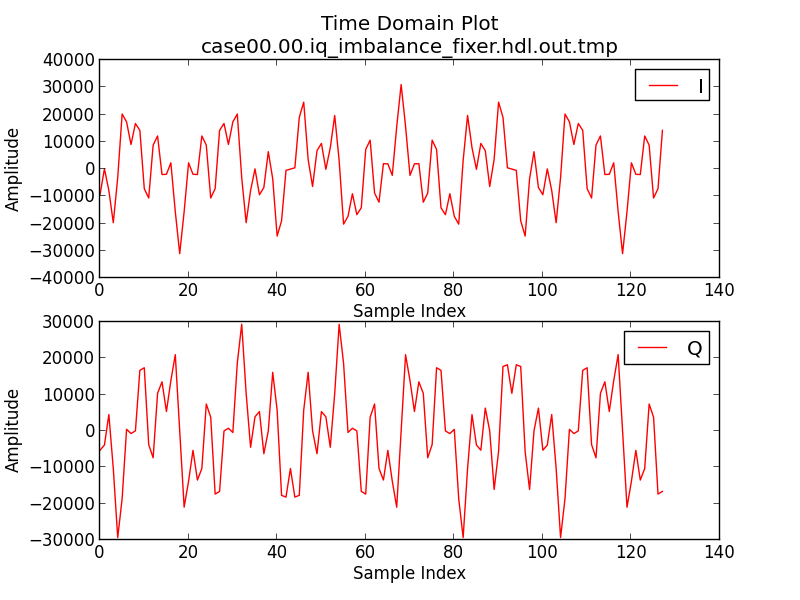
Figure 145: Time Domain Tones with Spectral Image removed
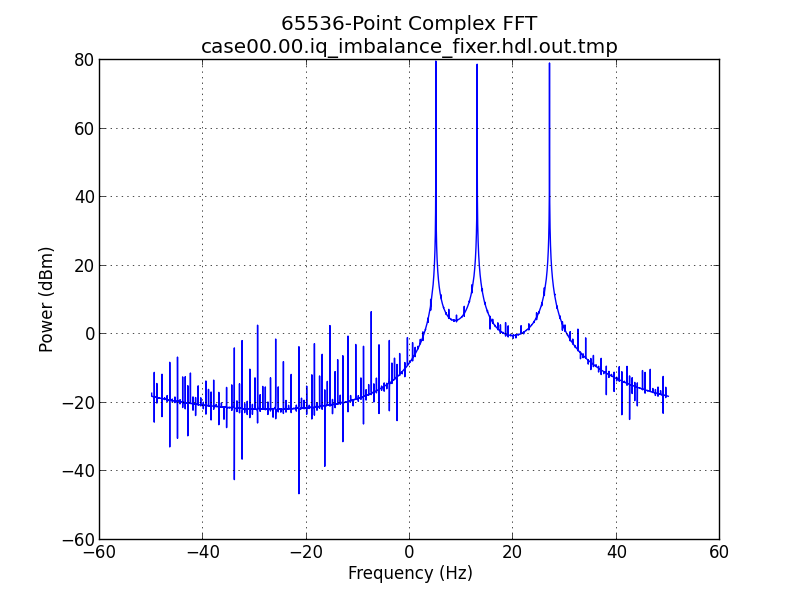
Figure 146: Frequency Domain Tones with Spectral Image removed